Integrated visual analysis · Architecture + design

Understanding how visual structure shapes experience.

A comparative tool for assessing repetition, contrast and spatial rhythm across architectural views. Analysis remains on your device.

Begin an assessment
01 / Assessment

A clear process from image to insight.

01

Select a view

Bring in a clear architectural view. Orientation is corrected and every pixel is prepared locally.

02

Define the visual field

50.0° estimatedAssumed 50° vertical field of view
03

Assess the view

The image is read through overlapping two-degree regions. Calibrated mode applies the complete 256 × 256 Fourier workflow.

Select a view to begin.
03 / Approach

From visual field to Fourier residual.

Our approach brings together image calibration, local Fourier analysis and contrast-sensitivity weighting. It reveals where spatial structure moves furthest from the 1/f distribution common in natural scenes.

01Calibrated luminance

Correct orientation and translate sRGB into linear luminance.

02Local visual field

Assess two-degree regions at 50% overlap.

03Spectral structure

Window and transform each local region.

04Natural-image departure

Fit a fixed −1 slope and weight the residual.

05Spatial map

Return every residual to its position in the view.

The value of calibration

Spatial frequency is measured in cycles per degree. A defined field of view turns pixel spacing into a consistent visual scale.

A consistent comparison

Hold viewpoint, lens, crop, exposure and calibration constant. Compare the measures together and observe where local peaks move.

Reading the colour field

Colour is normalized within each view. It locates local concentration; it does not create a scale between unrelated images.

04 / Presentation

A shared language for evidence-led design review.

The presentation now forms a continuous editorial series. Each chapter moves from human experience through method and evidence to a disciplined way of comparing design variants.
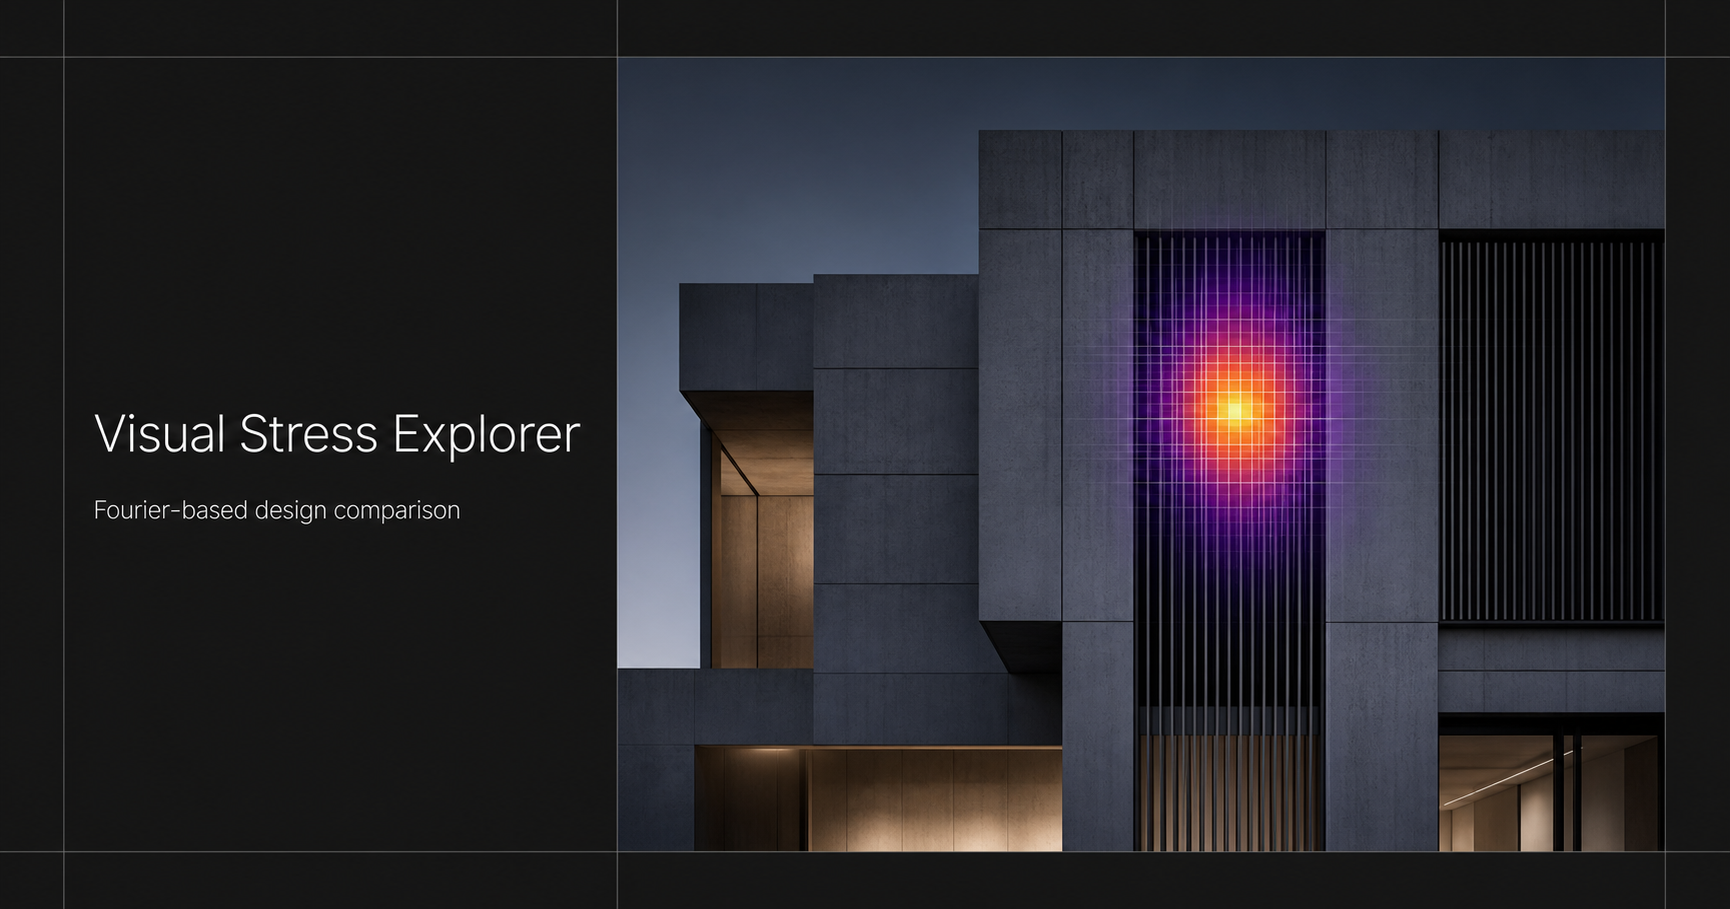
Architectural façade with a localized Fourier-residual heatmap
Independent research prototypeFor architecture + design

Visual Stress Explorer

Fourier-based design comparison

Method · application · limits01 / 10
Reading note

An independent research prototype for comparing how visual structure is distributed across architectural views.

VSEVisual experience02
Designing with human experience in mind

Understanding how repetition shapes experience.

Architecture establishes rhythm through form, spacing, contrast and viewpoint. Where these elements repeat at visually sensitive scales, they can create a demanding field for some viewers.

Spatial questionWhere?

Locate the regions where visual structure becomes most concentrated.

Design questionWhich move?

Hold the view constant and explore how a measured change reshapes the field.

3cycles / degree

A useful reference within the mid-frequency sensitivity range — not a universal threshold.

Reading note

Visual structure is one part of a wider human experience. The research describes reported discomfort across images, not a deterministic response for every person.

VSEEvidence + judgement03
A measured approach

Evidence for design judgement — not diagnosis.

Research basisFourier residual

Published research relates reported discomfort to departures from the typical spatial distribution of Fourier energy.

Design applicationCalibrated comparison

Architectural studies combine local residuals, view-wide measures and spatial variation to assess façades and interiors.

Claim boundaryIndividual experience

No single score can determine an individual response or establish universal medical risk bands.

The value lies in comparison: which consistently captured option creates a more balanced visual field?

Reading note

The prototype translates a published image statistic into evidence that supports, rather than replaces, design judgement.

VSECalibration04
Connecting image geometry with visual angle

A defined view creates a common scale.

vertical field of view
2 · atansensor height2 × focal length

then convert radians → degrees

01Define the angle

Use a known vertical field of view.

02Use camera geometry

Calculate from sensor height and focal length.

03Hold the view

Keep crop, exposure and camera position consistent.

The estimated overview supports orientation. Calibrated assessment creates a reproducible comparison.

Reading note

A calibrated vertical field of view converts image geometry into cycles per degree and makes controlled comparisons reproducible.

VSEFourier + 1/f05
Reading spatial structure

Understanding what the spectrum adds beyond 1/f.

Natural scenes often follow a characteristic decline in amplitude across spatial frequency. The method fits that −1-slope profile, weights the difference through contrast sensitivity and gathers the remaining energy.

Excluded
DC + first four frequency bins
Fitted
Fixed −1 slope; least-squares gain
03691215 c/deg

The weighting curve describes visual sensitivity. It does not define a risk boundary.

Reading note

The contrast-sensitivity model focuses the assessment on frequencies to which vision is especially responsive.

VSELocal analysis06
From whole view to local insight

Overlapping windows reveal spatial concentration.

01Standardise

Each square → 256 × 256

02Taper

Apply a 2D Hanning window

03Transform

Read the Fourier amplitude

04Compare

Fit, weight and gather residual energy

05Locate

Return each score to the visual field

Reading note

Two-degree regions move across the view at 50% overlap, preserving the location of each local Fourier residual.

VSEIntegrated reading07
Three complementary measures

Three measures. One integrated assessment.

Peak residualLocal maximum

Locate the most pronounced departure and return to its architectural context.

Average residualView-wide mean

Compare the overall level across consistently captured design variants.

Coefficient of variationSpatial concentration

Distinguish a local focus from a response distributed across the view.

Orientation, strongest cycles per degree, mid-frequency energy, contrast and periodicity extend the reading of spatial structure.

Reading note

Peak, average and variation answer different questions and should be read together with the spatial map and diagnostics.

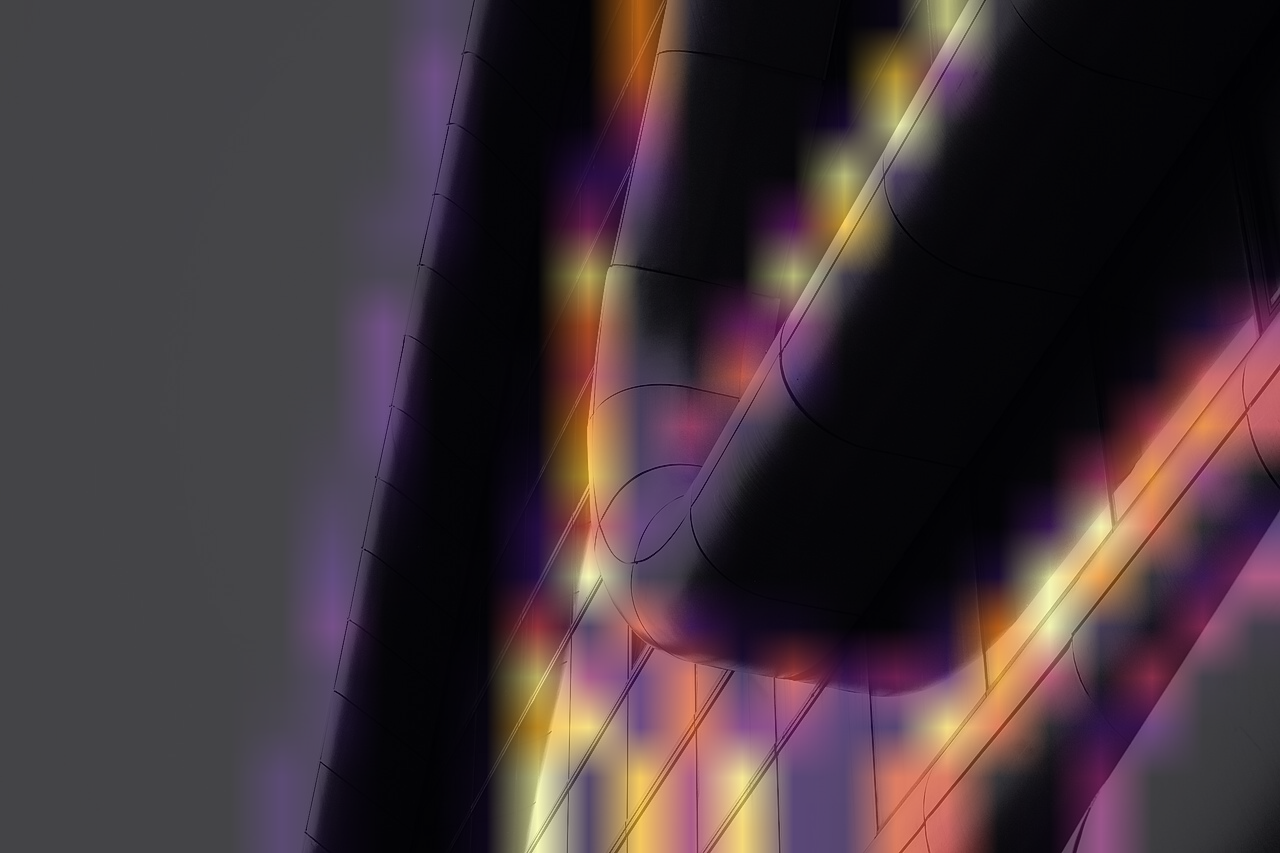
VSESpatial map08
A calibrated design reading

Locate the concentration. Return to the architecture.

Original architectural view
Original view
Architectural view with relative Fourier-residual heatmap
72% heatmap overlay
Peak 8.125e11Average 7.363e10CV 2.053Strongest frequency 2.92 c/deg

Colour is normalized within this view. It reveals where repeated geometry concentrates; numerical comparison requires the same calibration.

Reading note

The colour field is relative within one image. It locates concentrated structure; numerical comparison requires the same calibration.

VSEDesign response09
From evidence to design response

Evolve the rhythm with intent.

01Locate

Find the strongest local regions within the intended visual field.

02Understand

Relate orientation and frequency to visible architectural structure.

03Explore

Test spacing, contrast, depth, material transition and hierarchy.

04Compare

Hold the view constant and read all three measures together.

The analysis informs professional judgement. It does not assign architectural meaning or prescribe a design language.

Reading note

The analysis can open a design conversation while leaving architectural meaning, context and intent with the design team.

VSEComparison protocol10
A disciplined comparison process

One view. One calibration. One design change.

ACapture

Fix viewpoint, lens, crop and exposure.

BCalibrate

Record vertical field of view and method version.

CAssess

Read peak, average, variation and location together.

DIntegrate

Combine the evidence with user insight and design judgement.

Independent research prototypeNot official Cambridge software · Not a medical diagnosis · Colour remains view-relative
Reading note

Controlled comparison supports design development without creating universal thresholds or medical conclusions.

Independent research prototype. The presentation does not reproduce or claim equivalence with the official Cambridge ViStA software.

05 / Responsible use

Evidence to support design judgement.

This independent prototype translates publicly described research into a comparative design tool. It is not the official Cambridge ViStA software and does not predict an individual response.

The observations describe spatial structure, not architectural meaning. They neither identify validated design causes nor create universal low, medium or high risk bands.